Redlining and the HOLC
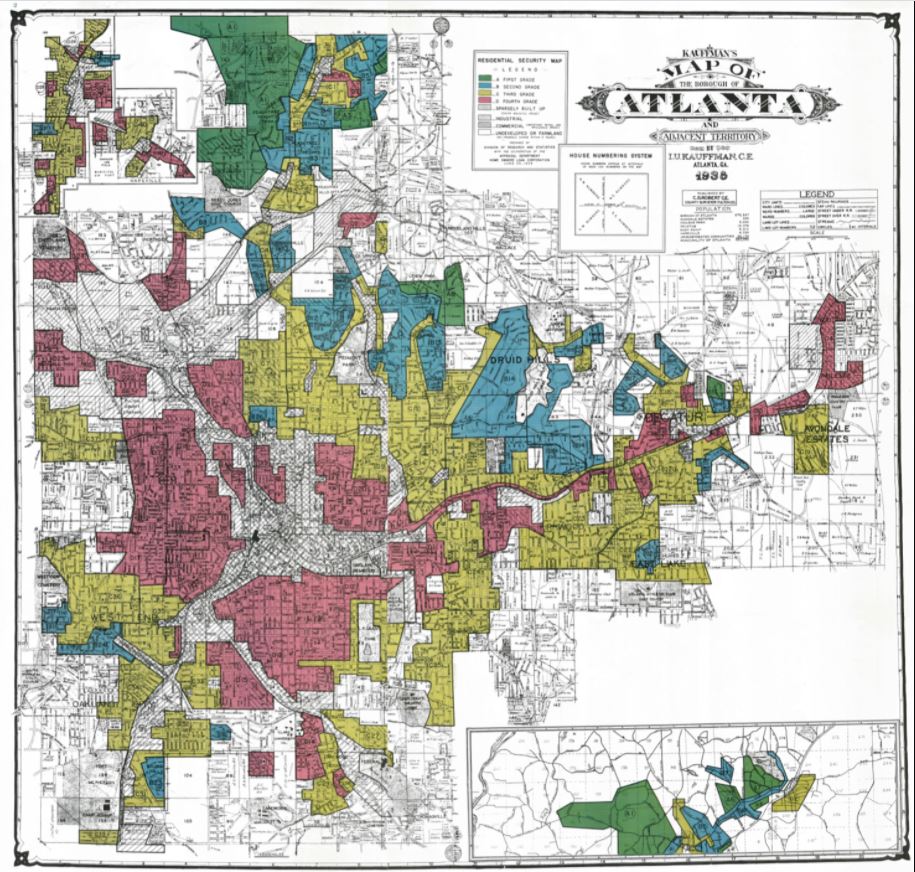
What were the federal “redlining” maps actually for? I read them as windows into the racial-spatial ideology of twentieth-century real estate, not just as tools for denying loans.
The City Survey Program
This project aims to reframe how researchers and the broader public think about the processes through which racial inequities have been continuously reproduced in sub/urban spaces through time. It centers on the Home Owners’ Loan Corporation’s (HOLC) “City Survey” program, which the federal government ran in partnership with the real estate industry in the late 1930s to map and grade thousands of neighborhoods in more than 200 cities. The infamous A-to-D grades reflected dominant ideas within the real estate industry about how neighborhood features affected the investment potential of residential property. Among other demographic, socioeconomic, housing, and locational characteristics, the visible presence of Black and non-white immigrant residents weighed heavily in the grading, leading many researchers to credit HOLC with spearheading the practice of “redlining.”
The precise impact these maps had on the sub/urban housing landscape, however, remains hotly contested. In my critical reappraisal of the redlining debates in Urban Studies, I contend that the maps and their accompanying “Area Description” sheets are better seen as windows into the governing racial-spatial ideology of twentieth-century real estate capital than as objects literally used to make lending decisions. With Steve Holloway in the Annals of the American Association of Geographers, I put the HOLC data to use in a statistical analysis showing that racial segregation is a more salient source of lasting injustice than map grades, work that won the IPUMS Spatial Research Award. In Urban Geography, A. Bonds and I used qualitative GIS to show how appraisers applied a “racist theory of value” that went far beyond the maps.

Tabulating the Area Descriptions
The Digital Scholarship Lab at the University of Richmond has made the HOLC maps and field notes available through Mapping Inequality, along with a geopackage and GeoJSON for use in GIS software. Building on that effort, I converted the data in HOLC’s Area Descriptions into readable tables, called THOLCADS, available at Open Science Framework and through the Leventhal Map & Education Center. Variables such as the Black population percentage, “foreign born” percentage and group, family income, occupation class, average building age, repair status, and mortgage availability are ready for statistical analysis, and the remaining entries can be searched by keyword. The R code is on GitHub, and the background and methods are in Environment and Planning B.
Zoom into a city and click on one of its HOLC neighborhoods to see its attributes. Switch basemaps with the layer icon on the left.
Data: THOLCADS on OSFOpen full-screen map ↗
What the Area Descriptions show
Despite some noteworthy regional variation, the Black population share, “foreign born” share, and building age rise as grades move from A to D, while family income moves the other way. That is expected: these factors all shaped how lenders, brokers, landlords, appraisers, and others in real estate judged an area’s potential returns. The visible presence of Black residents in particular was widely assumed to harm property values. As the top-left panel shows, almost every neighborhood with any Black residents at all received a D.
Black residents
“Foreign born” residents
Family income midpoint
Building age midpoint
Home repair status, mortgage availability, and resident occupation class break down by grade in the same way.
Home repair status
Mortgage availability
Occupation class
Bars show the share of each grade’s neighborhoods (%), with the best category at left.
We can also ask how appraisers graded neighborhoods based on which “foreign born” groups lived there. The next chart counts the HOLC neighborhoods where each group is at least mentioned.
Share of neighborhoods mentioning each group, by grade (%). Numbers after each group are neighborhoods.
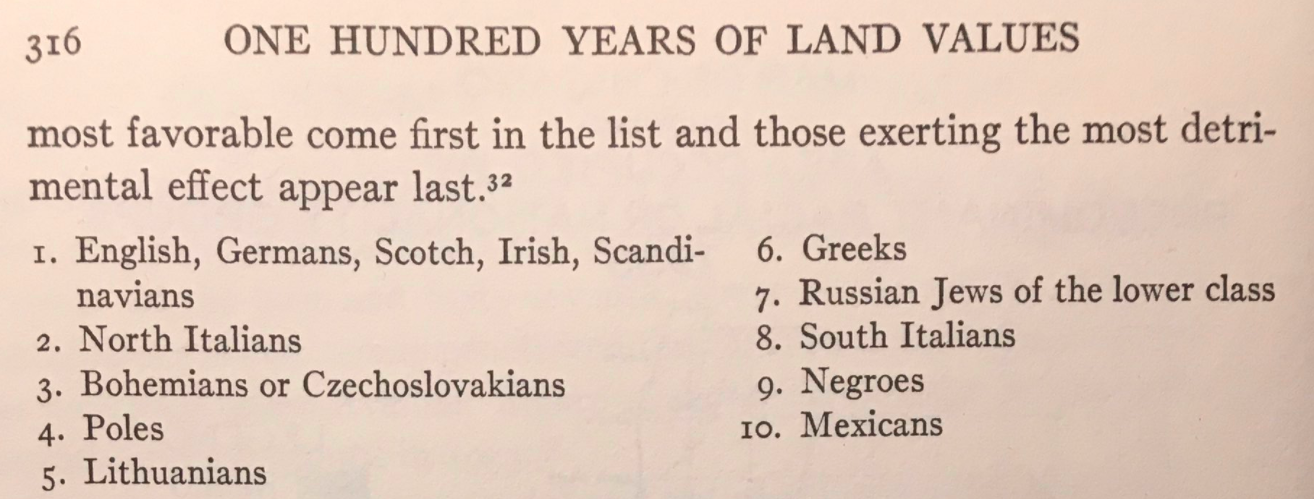
The relationship between grades and groups closely tracks the racist ranking published by the land economist Homer Hoyt in his 1933 One Hundred Years of Land Values in Chicago, which claimed that land values rose or fell depending on which of these populations lived nearby. Hoyt’s book was exceptionally well regarded in the industry, and he went on to serve as chief economist of the Federal Housing Administration (FHA), where he was instrumental in the agency’s adoption of its own redlining maps and policies.
Read more
- Markley, S. and A. Bonds. (2025). Race and value in space and time: a critical narrative cartography of the Home Owners’ Loan Corporation’s Area Descriptions. Urban Geography 46(9): 1921–1942.
- Swope, C., S. Markley, S. Whittaker, and A. Hillier. (2025). How and why does redlining matter for present-day health? Critical perspectives on causality, cartography, and capitalism. American Journal of Public Health 115: 769–779.
- Markley, S. and S. Holloway. (2024). Underestimating racism? Decoupling race and redlining. Annals of the American Association of Geographers 114(7): 1464–1482.
- Markley, S. (2024). Planning spatial obsolescence: residential segregation and the racist theory of (anti-)value. Environment & Planning D: Society and Space 42(5–6): 758–775.
- Markley, S. (2024). Federal ‘redlining’ maps: a critical reappraisal. Urban Studies 61(2): 195–213.
- Markley, S. (2024). Housing, socioeconomic, and racial data in consistent neighborhood geometries for 65 cities mapped by the Home Owners’ Loan Corporation, 1940–2019. SocArXiv.
- Markley, S. (2023). Tabulating Home Owners’ Loan Corporation area description sheet data. Environment & Planning B: Urban Analytics and City Science 50(1): 268–280.
- Markley, S. (2023). Atlanta, Georgia. In Mapping Inequality: Redlining in New Deal America, R. Nelson and L. Winling (eds.).